1.安装Prometheus服务端
1.创建数据目录
mkdir -p /yschome/data/prometheus/etc /yschome/data/prometheus/data
2.创建配置文件
cat << EOF > /yschome/data/prometheus/etc/prometheus.yml
global:
  scrape_interval:     15s
  evaluation_interval: 15s
scrape_configs:
  - job_name: 'container'
    static_configs:
    - targets: ['10.20.140.104:9090',,'10.20.140.105:9090']
      labels:
        instance: cadvisor
  - job_name: 'node'
    static_configs:
    - targets: ['10.20.140.104:9100']
      labels:
        instance: 10.20.140.104
    - targets: ['10.20.140.105:9100']
      labels:
        instance: 10.20.140.105
  - job_name: prometheus
    static_configs:
    - targets: ['10.20.140.103:9090']
      labels:
        instance: prometheus
  - job_name: 'linux'
    static_configs:
    - targets: ['10.20.102.91:9100']
      labels:
        instance: test05_cadb
    - targets: ['10.20.102.92:9100']
      labels:
        instance: test05_psmsdb
  - job_name: 'mysql'
    static_configs:
    - targets: ['10.20.102.91:9104']
      labels:
        instance: test05_cadb
    - targets: ['10.20.102.92:9104']
      labels:
        instance: test05_psmsdb
EOF
3.使用docker启动服务端
开放9090端口,挂载前面创建的数据目录
docker run -d -p 9090:9090 --restart always  \
-v /yschome/data/prometheus/etc/:/etc/prometheus/ \
-v /yschome/data/prometheus/data/:/prometheus/ \
-v /etc/localtime:/etc/localtime --name prometheus \
 10.20.145.240/devrepo/prometheus:v1.0
2.安装Prometheus exporter监控端
监控Docker Swarm Mode 集群
swarm mode 集群所有的宿主机都需要装2个exporter
1.node_exporter
#使用docker安装node_exporter获取的数据有问题(可能是我使用了ingree网络导致数据采集了多次),所以采用二进制安装
cd /opt && wget http://download.ys-city.com/prometheus/node_exporter-0.14.0.linux-amd64.tar.gz
mkdir  prometheus_exporters
tar -zxvf node_exporter-0.14.0.linux-amd64.tar.gz -C /opt/prometheus_exporters  --strip-components=1
#启动
nohup /opt/prometheus_exporters/node_exporter &
2.cadvisor
#使用docker swarm mode global部署cadvisor
docker service create --mode=global  --network="my-net" \
--endpoint-mode=vip  \
--restart-condition=any   \
-name=cadvisor  \
--mount  type=bind,src=/,dst=/rootfs \
--mount  type=bind,src=/var/run,dst=/var/run\
--mount  type=bind,src=/sys,dst=/sys \
--mount  type=bind,src=/yschome/data/docker/,dst=/rootfs \
 10.20.145.240/library/cadvisor:v1.0
监控MySQL
在MySQL宿主机上安装2个exporter,均采用二进制安装
1.node_exporter
cd /opt && wget http://download.ys-city.com/prometheus/node_exporter-0.14.0.linux-amd64.tar.gz
mkdir  prometheus_exporters
tar -zxvf node_exporter-0.14.0.linux-amd64.tar.gz -C /opt/prometheus_exporters  --strip-components=1
#启动
nohup /opt/prometheus_exporters/node_exporter &
2.mysqld_exporter
cd /opt && wget http://download.ys-city.com/prometheus/mysqld_exporter-0.10.0.linux-amd64.tar.gz
tar -zxvf mysqld_exporter-0.10.0.linux-amd64.tar.gz -C /opt/prometheus_exporters  --strip-components=1
mkdir -p /usr/local/services/prometheus_exporters /opt/prometheus
#配置数据库授权账号,mysqld_exporter使用此账号收集数据库信息
cat << EOF > /usr/local/services/prometheus_exporters/.my.cnf
[client]
user=root
password=root
EOF
#启动
nohup /opt/prometheus_exporters/mysqld_exporter -config.my-cnf="/usr/local/services/prometheus_exporters/.my.cnf" &
3.安装Grafana图表
#使用docker安装grafana
docker run -d -p 3000:3000 --restart always --name grafana-new 10.20.145.240/library/grafana:v4.4.2
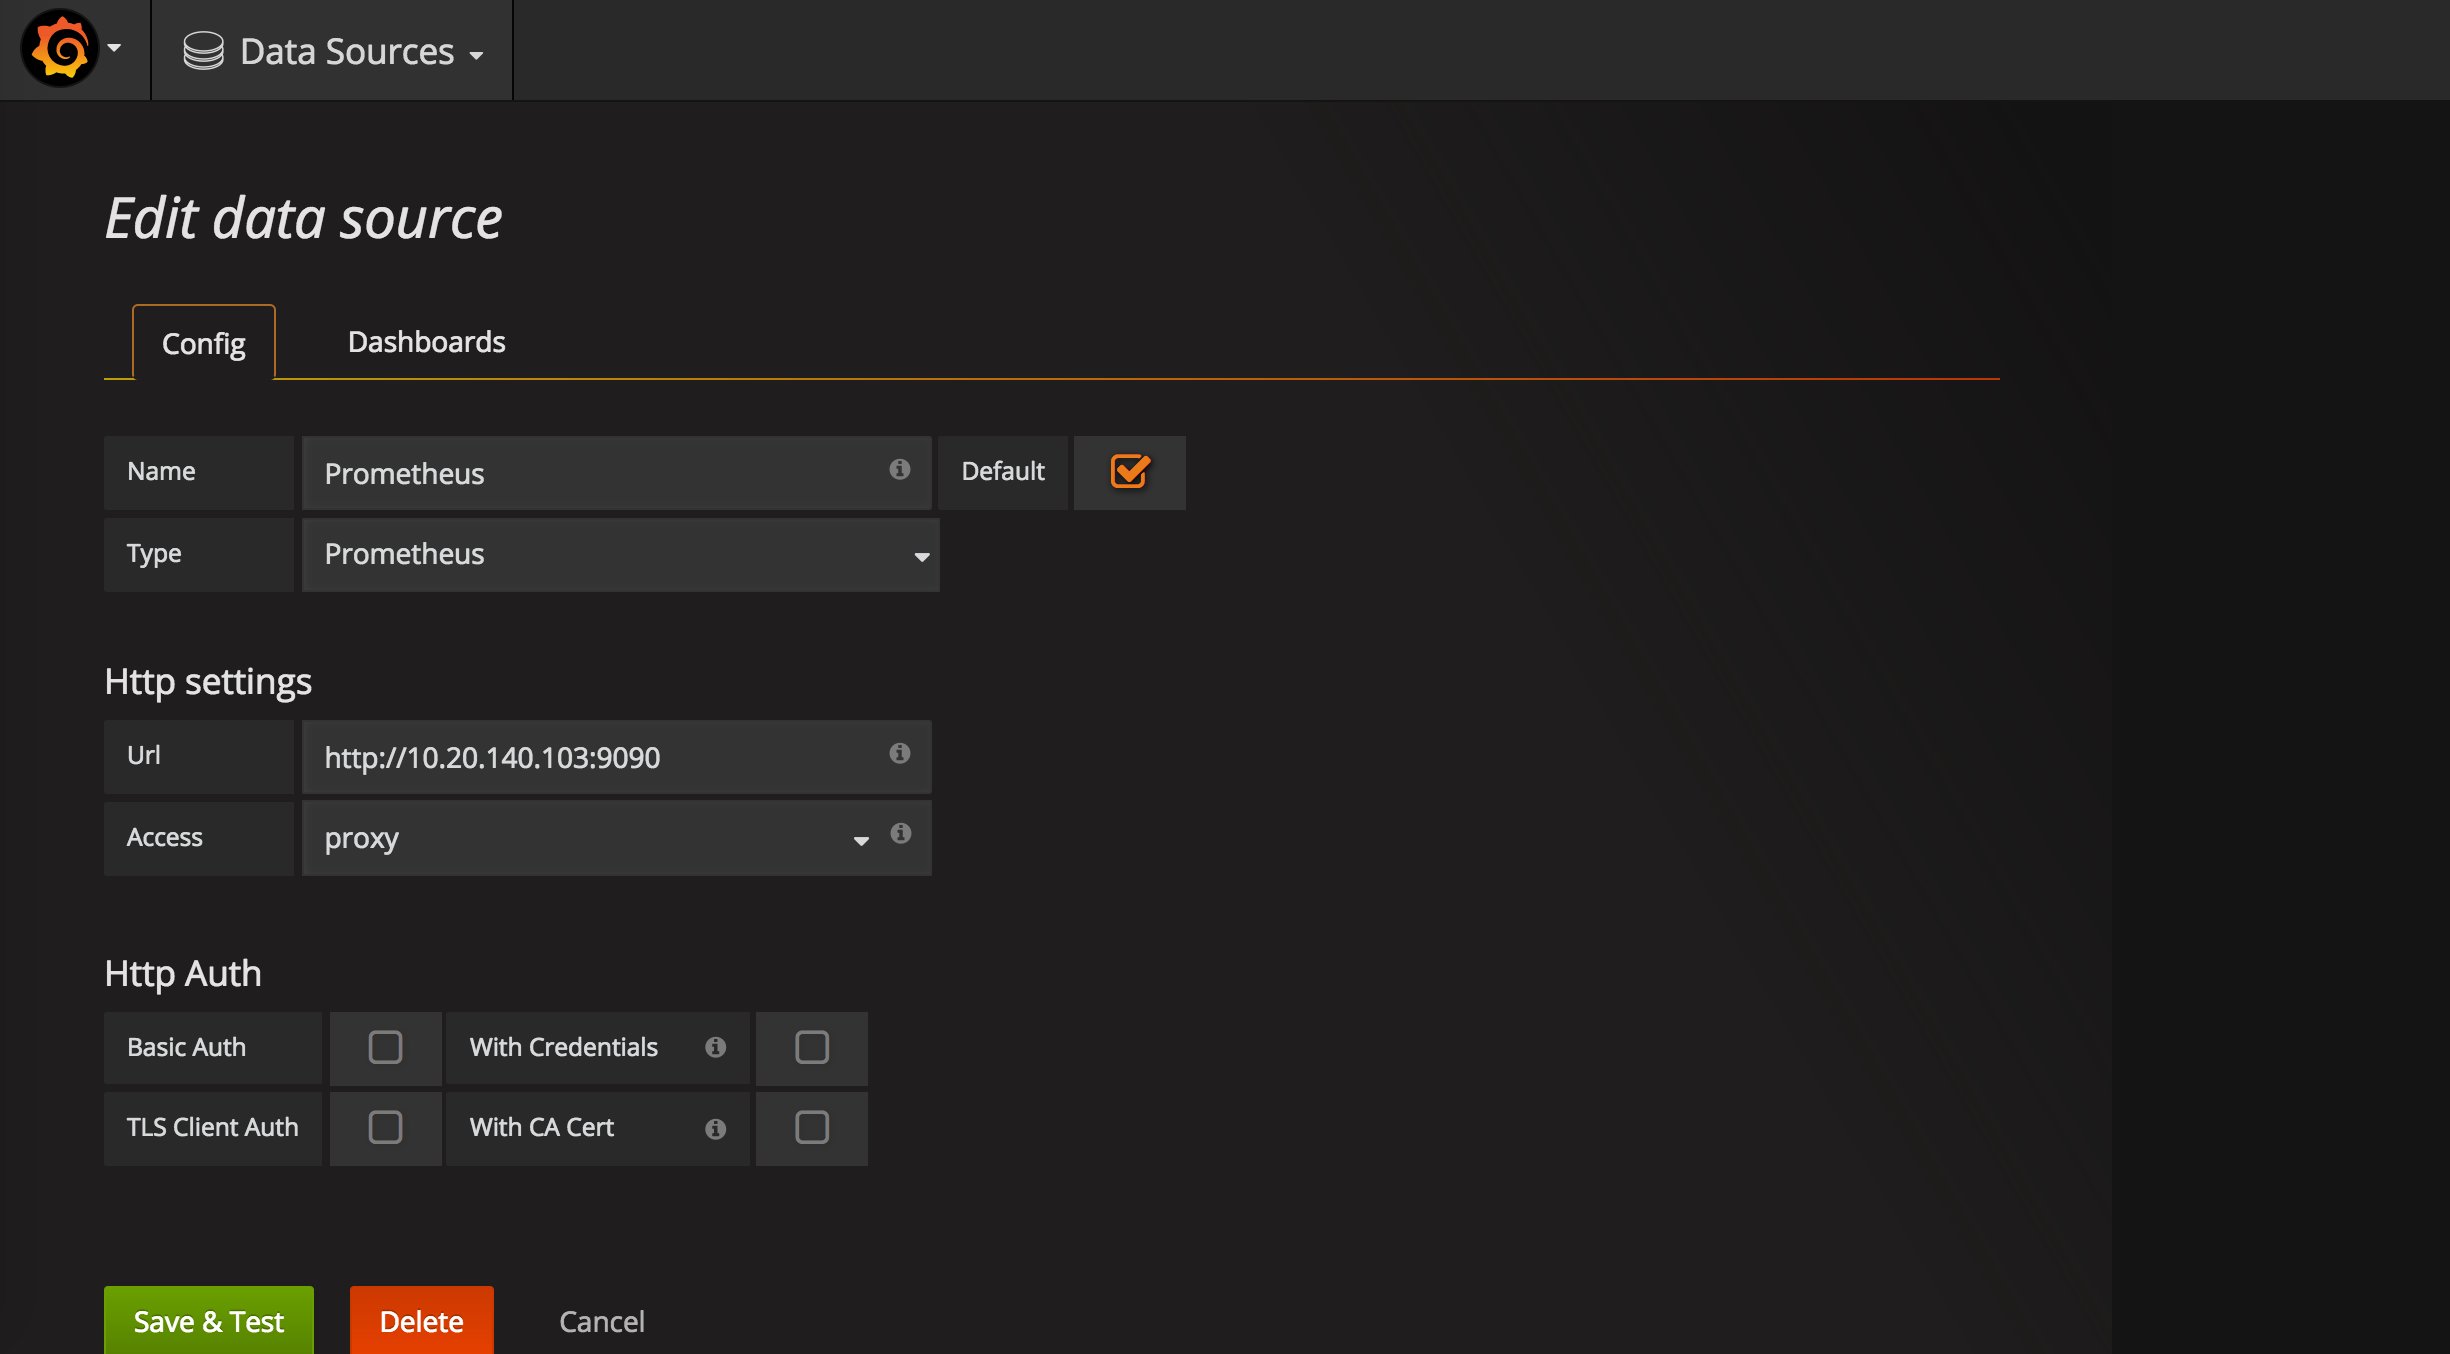
1.配置数据源
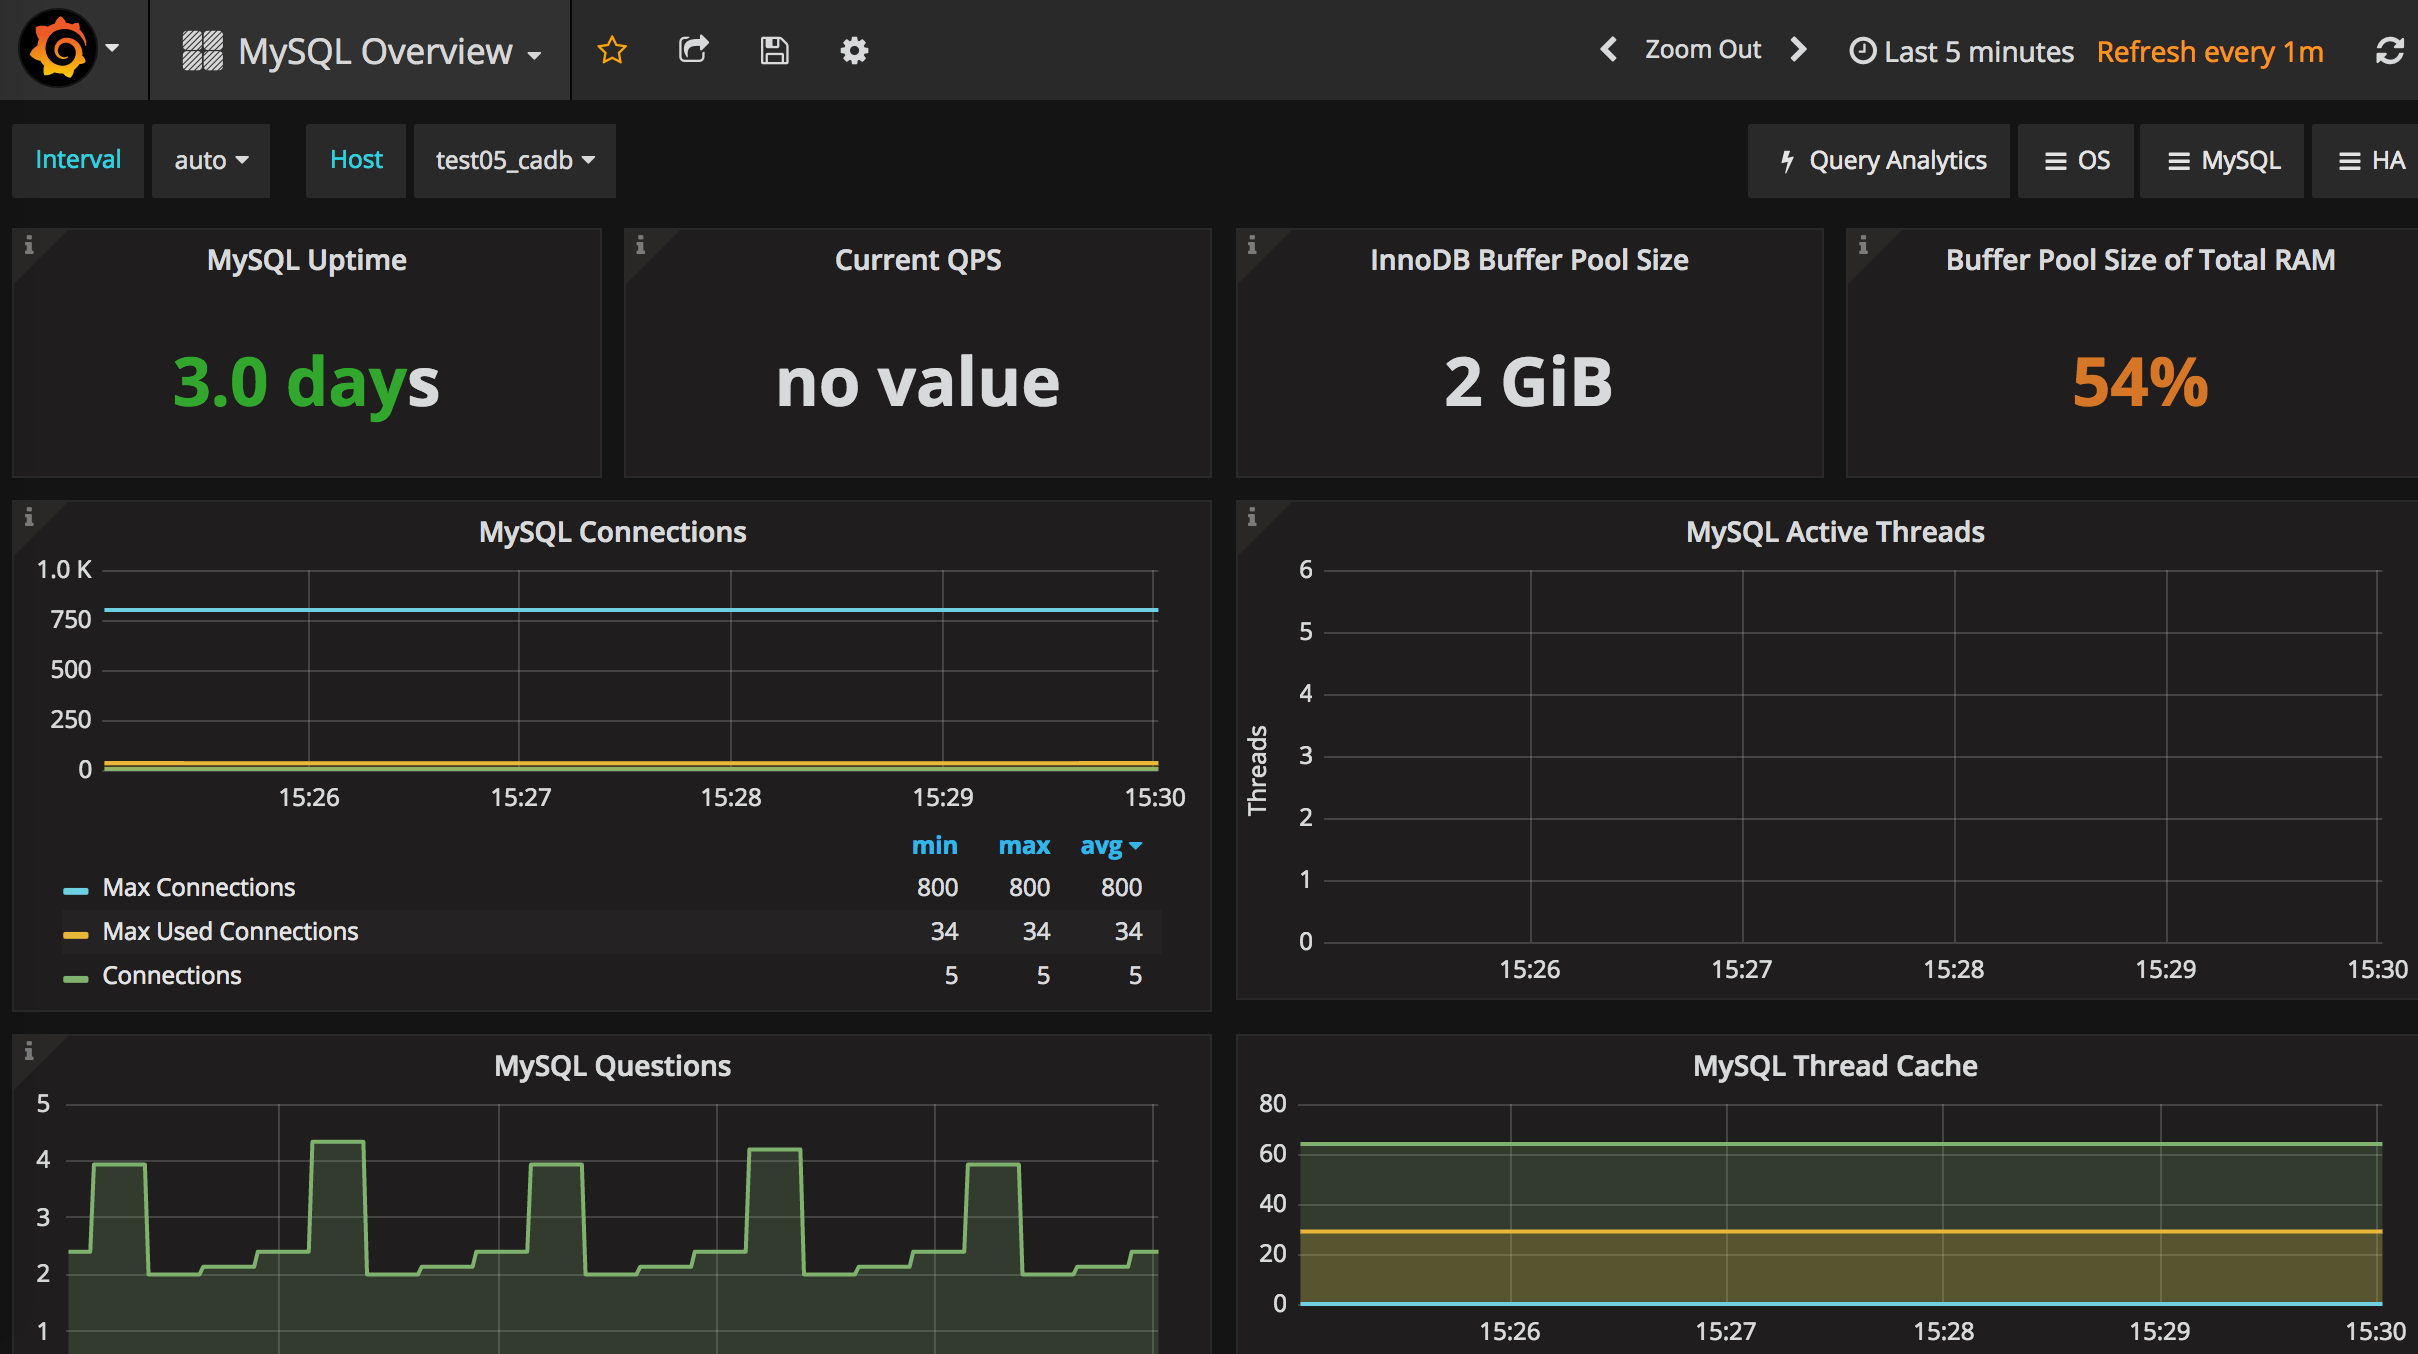
2.配置MySQL dashboards
可以直接安装Percona插件来展示MySQL监控数据
https://grafana.com/plugins/percona-percona-app
也可以下载percona的dashboards自己导入所需要的面板
https://github.com/percona/grafana-dashboards.git
我使用第二种方法下载我需要的面板然后导入
mysql_overview.json
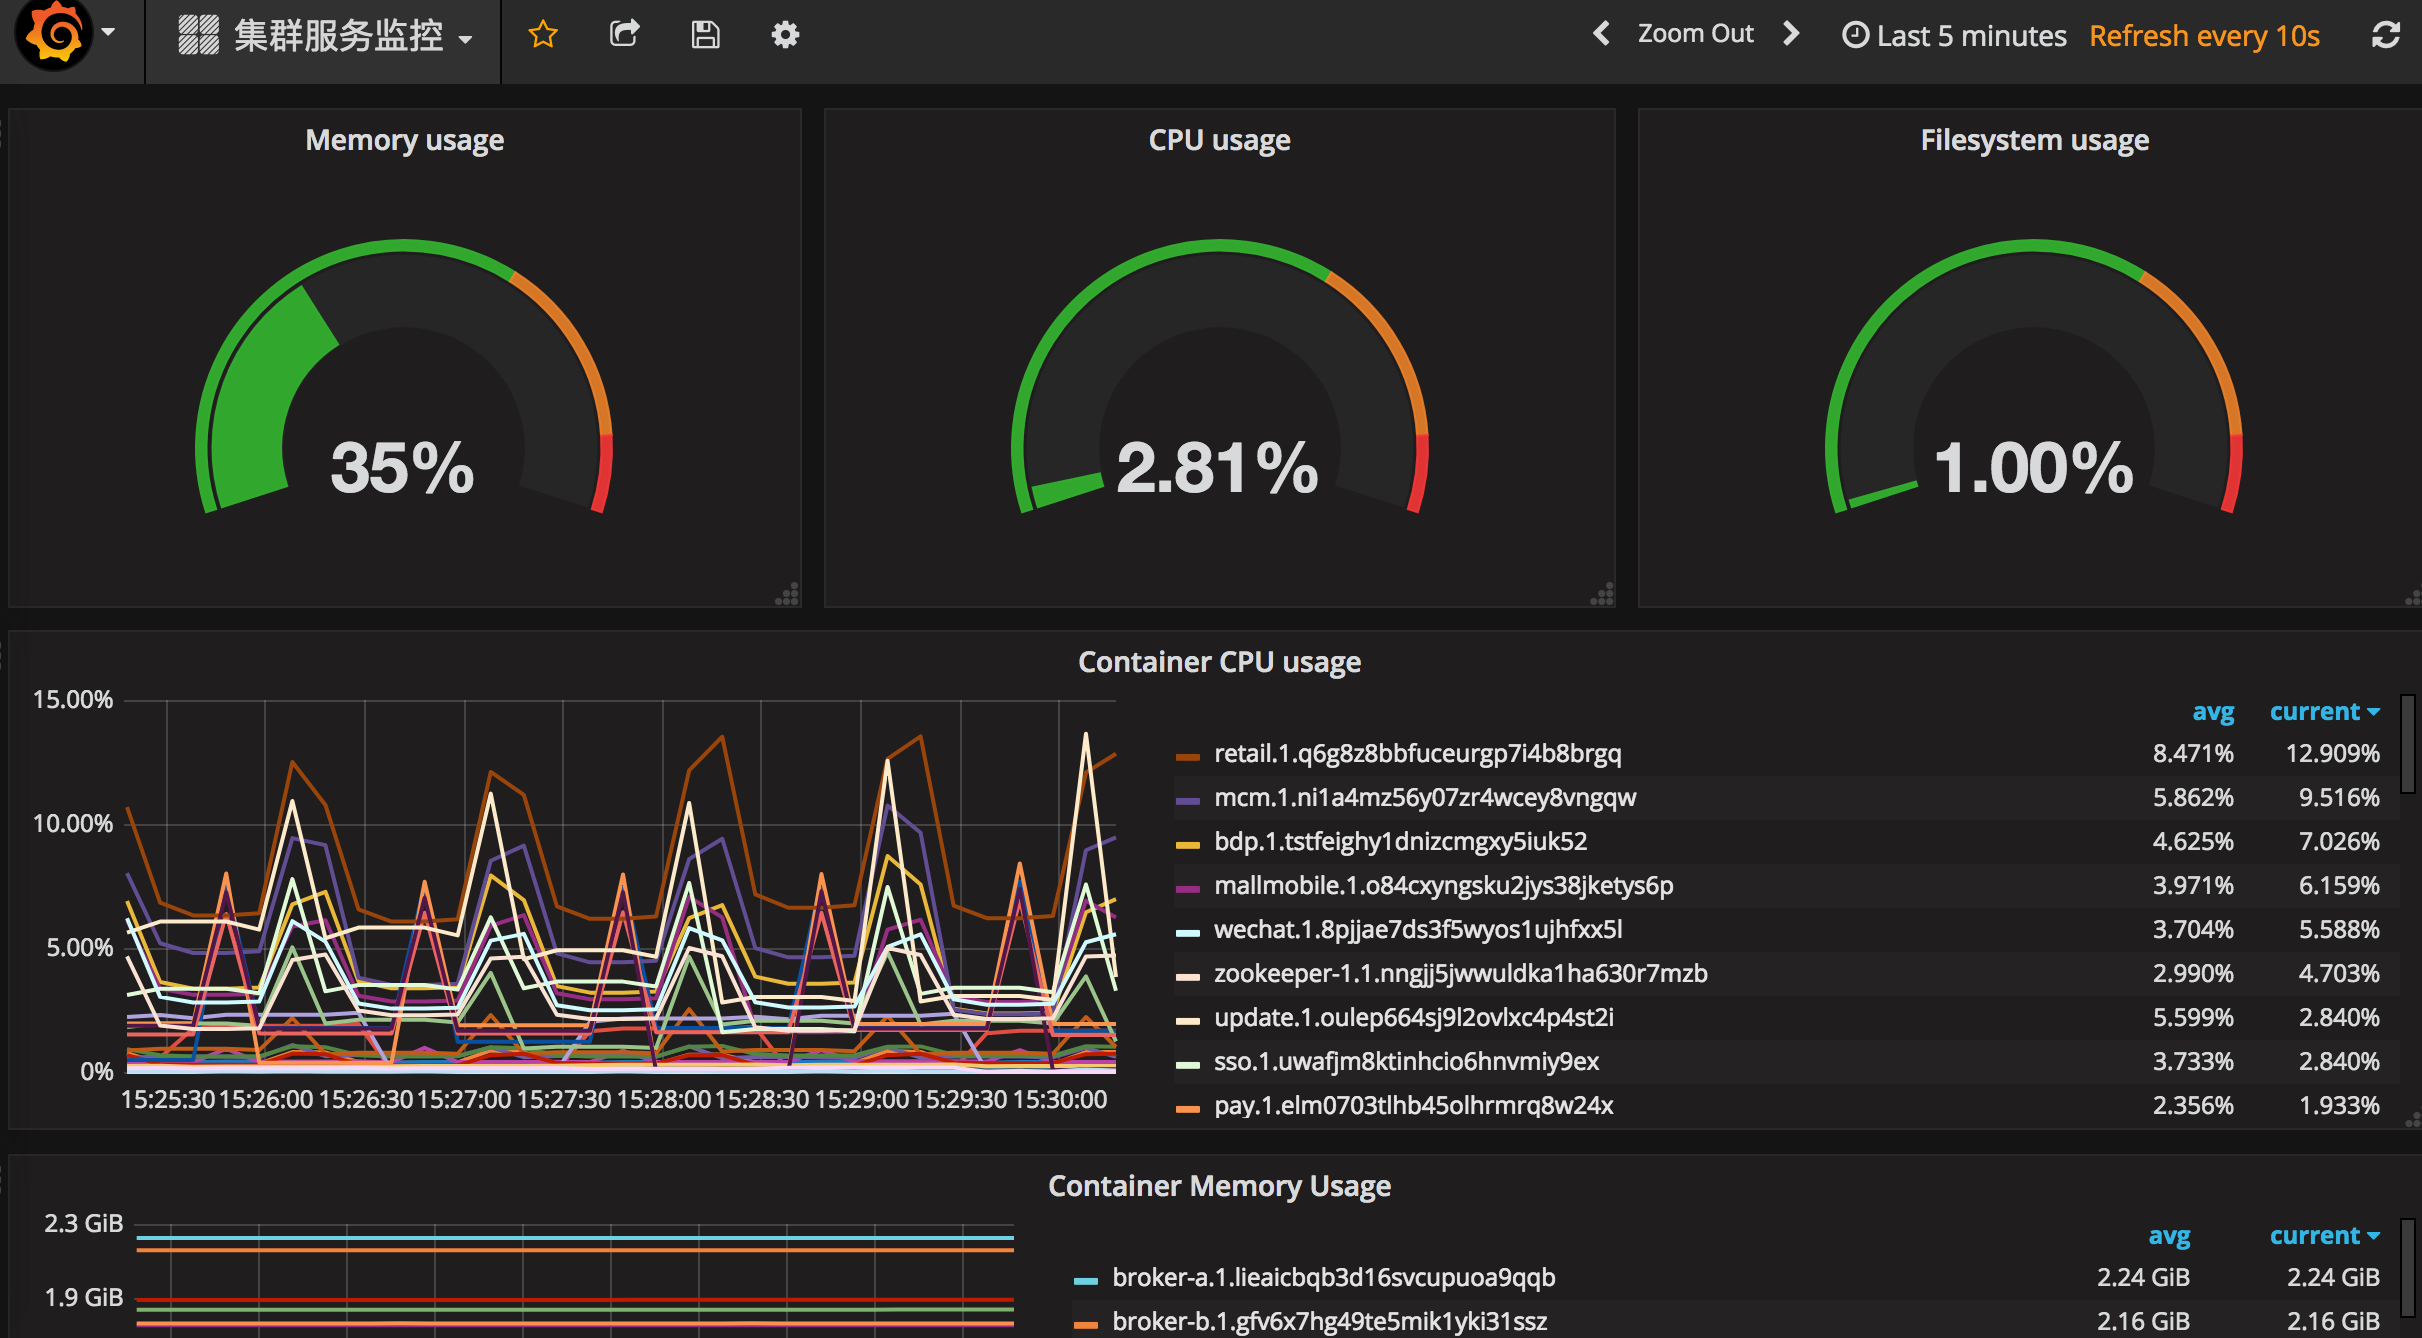
3.配置Swarm Mode监控面板
swarm_mode.json
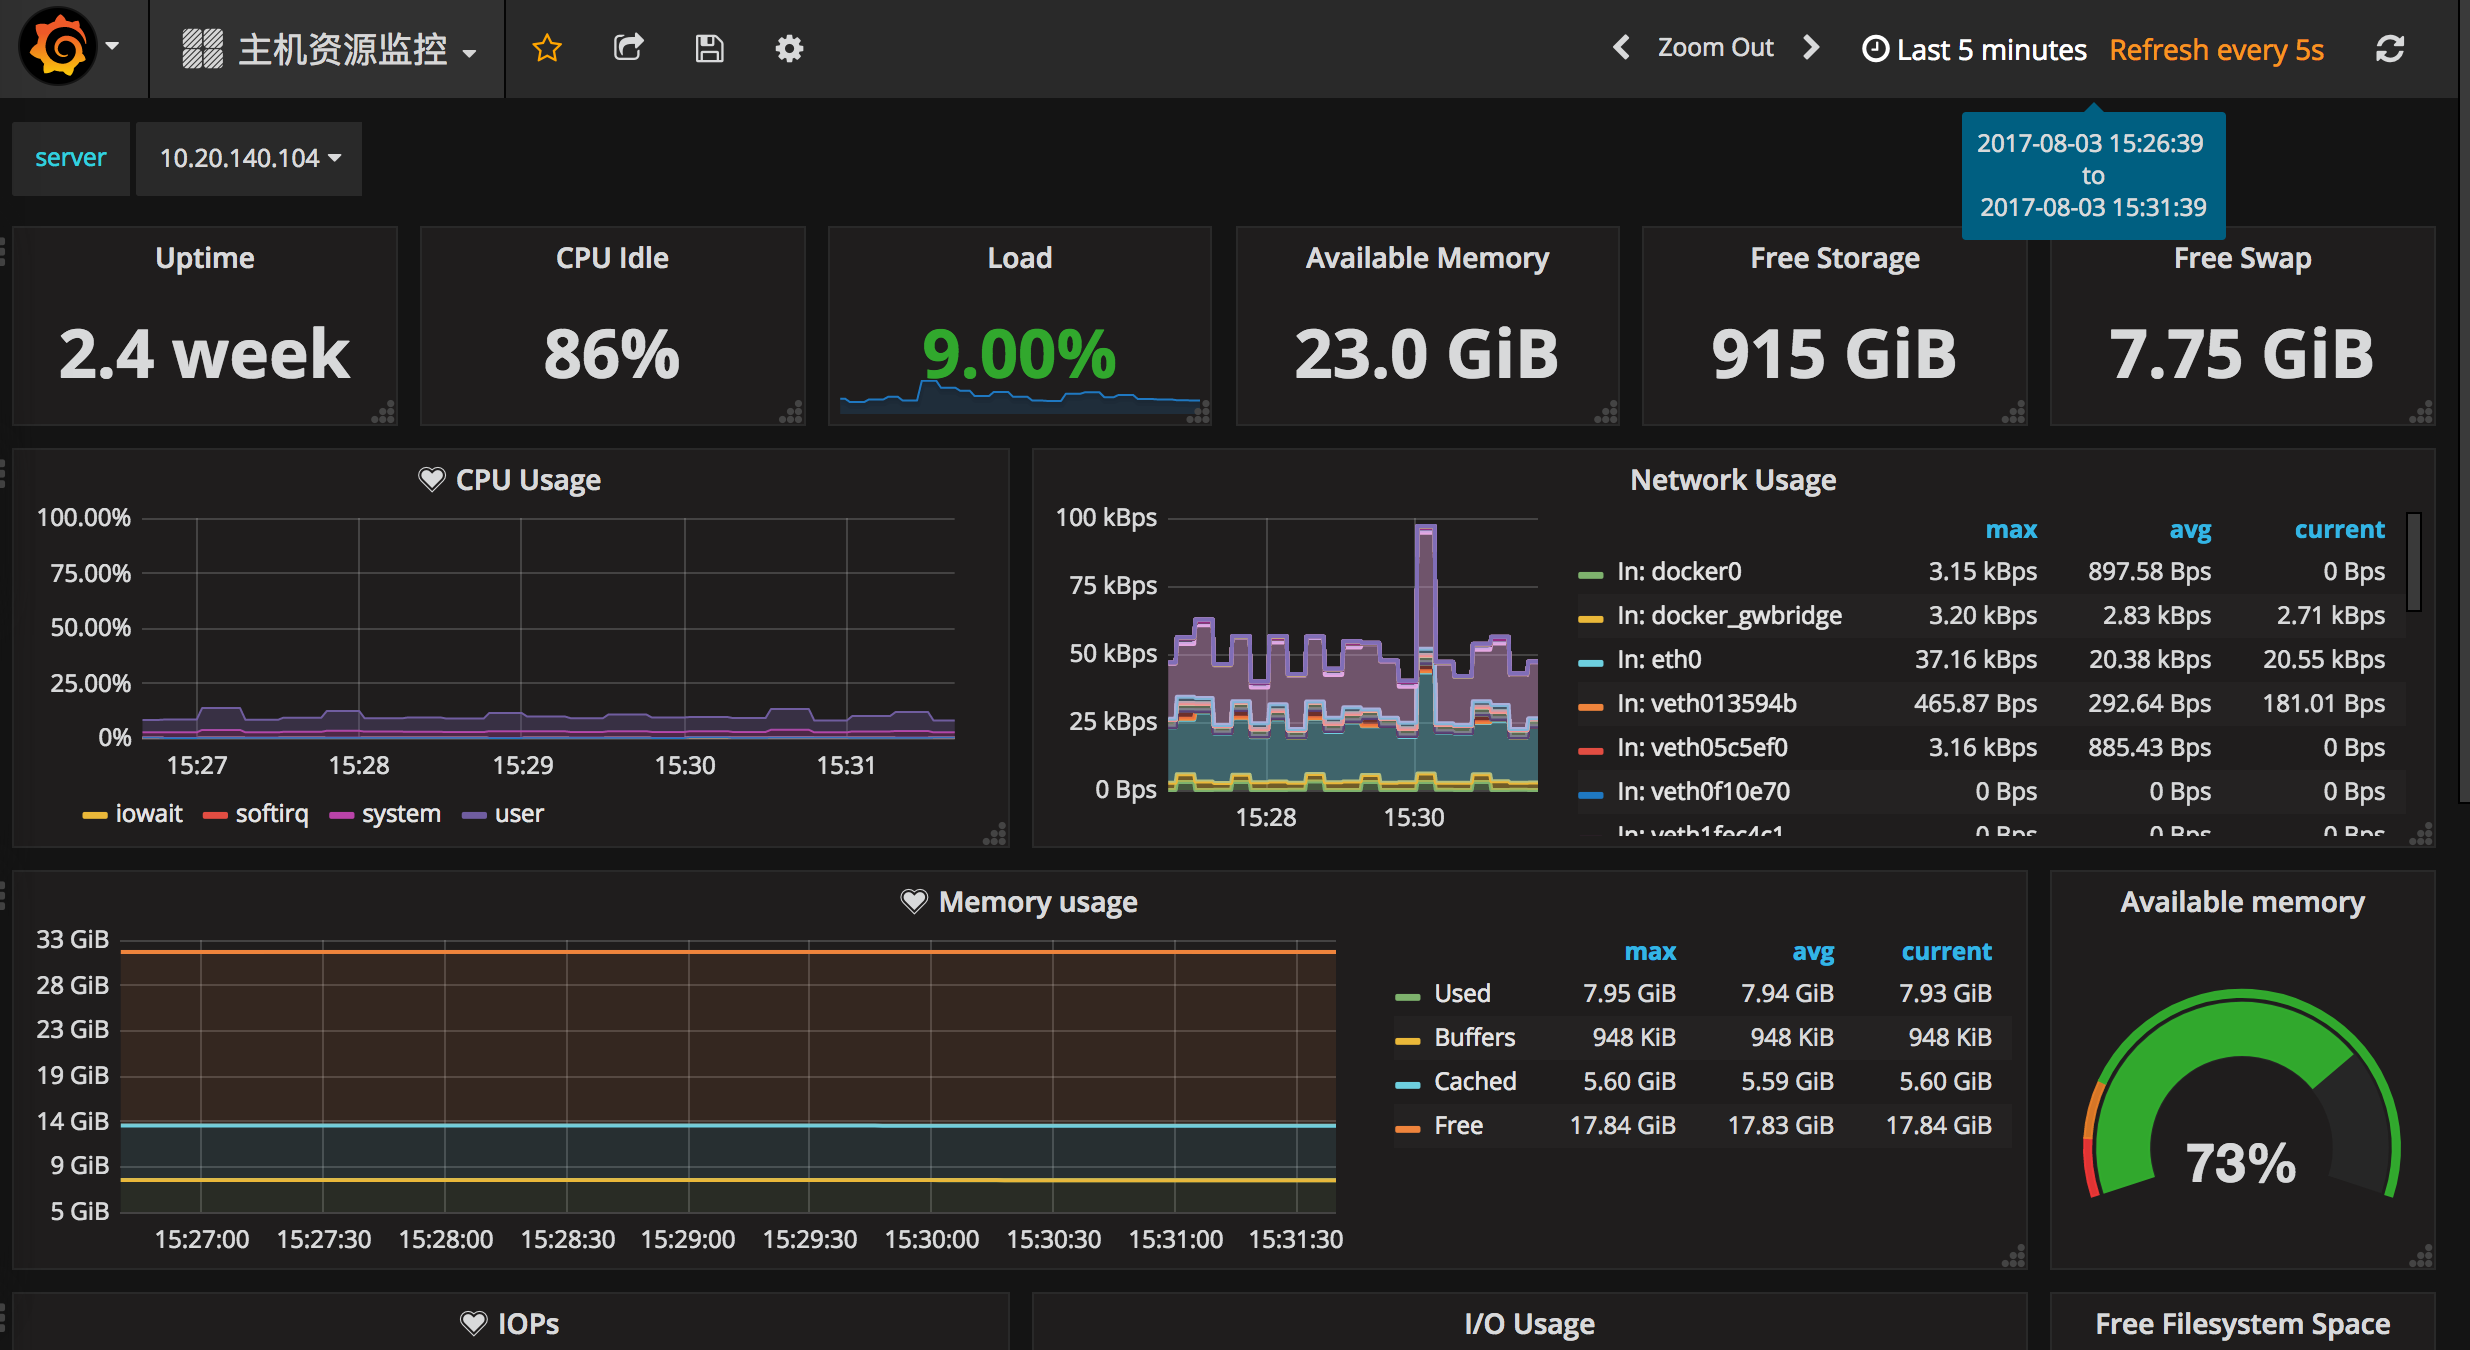
4.配置主机监控面板
Node-1.json
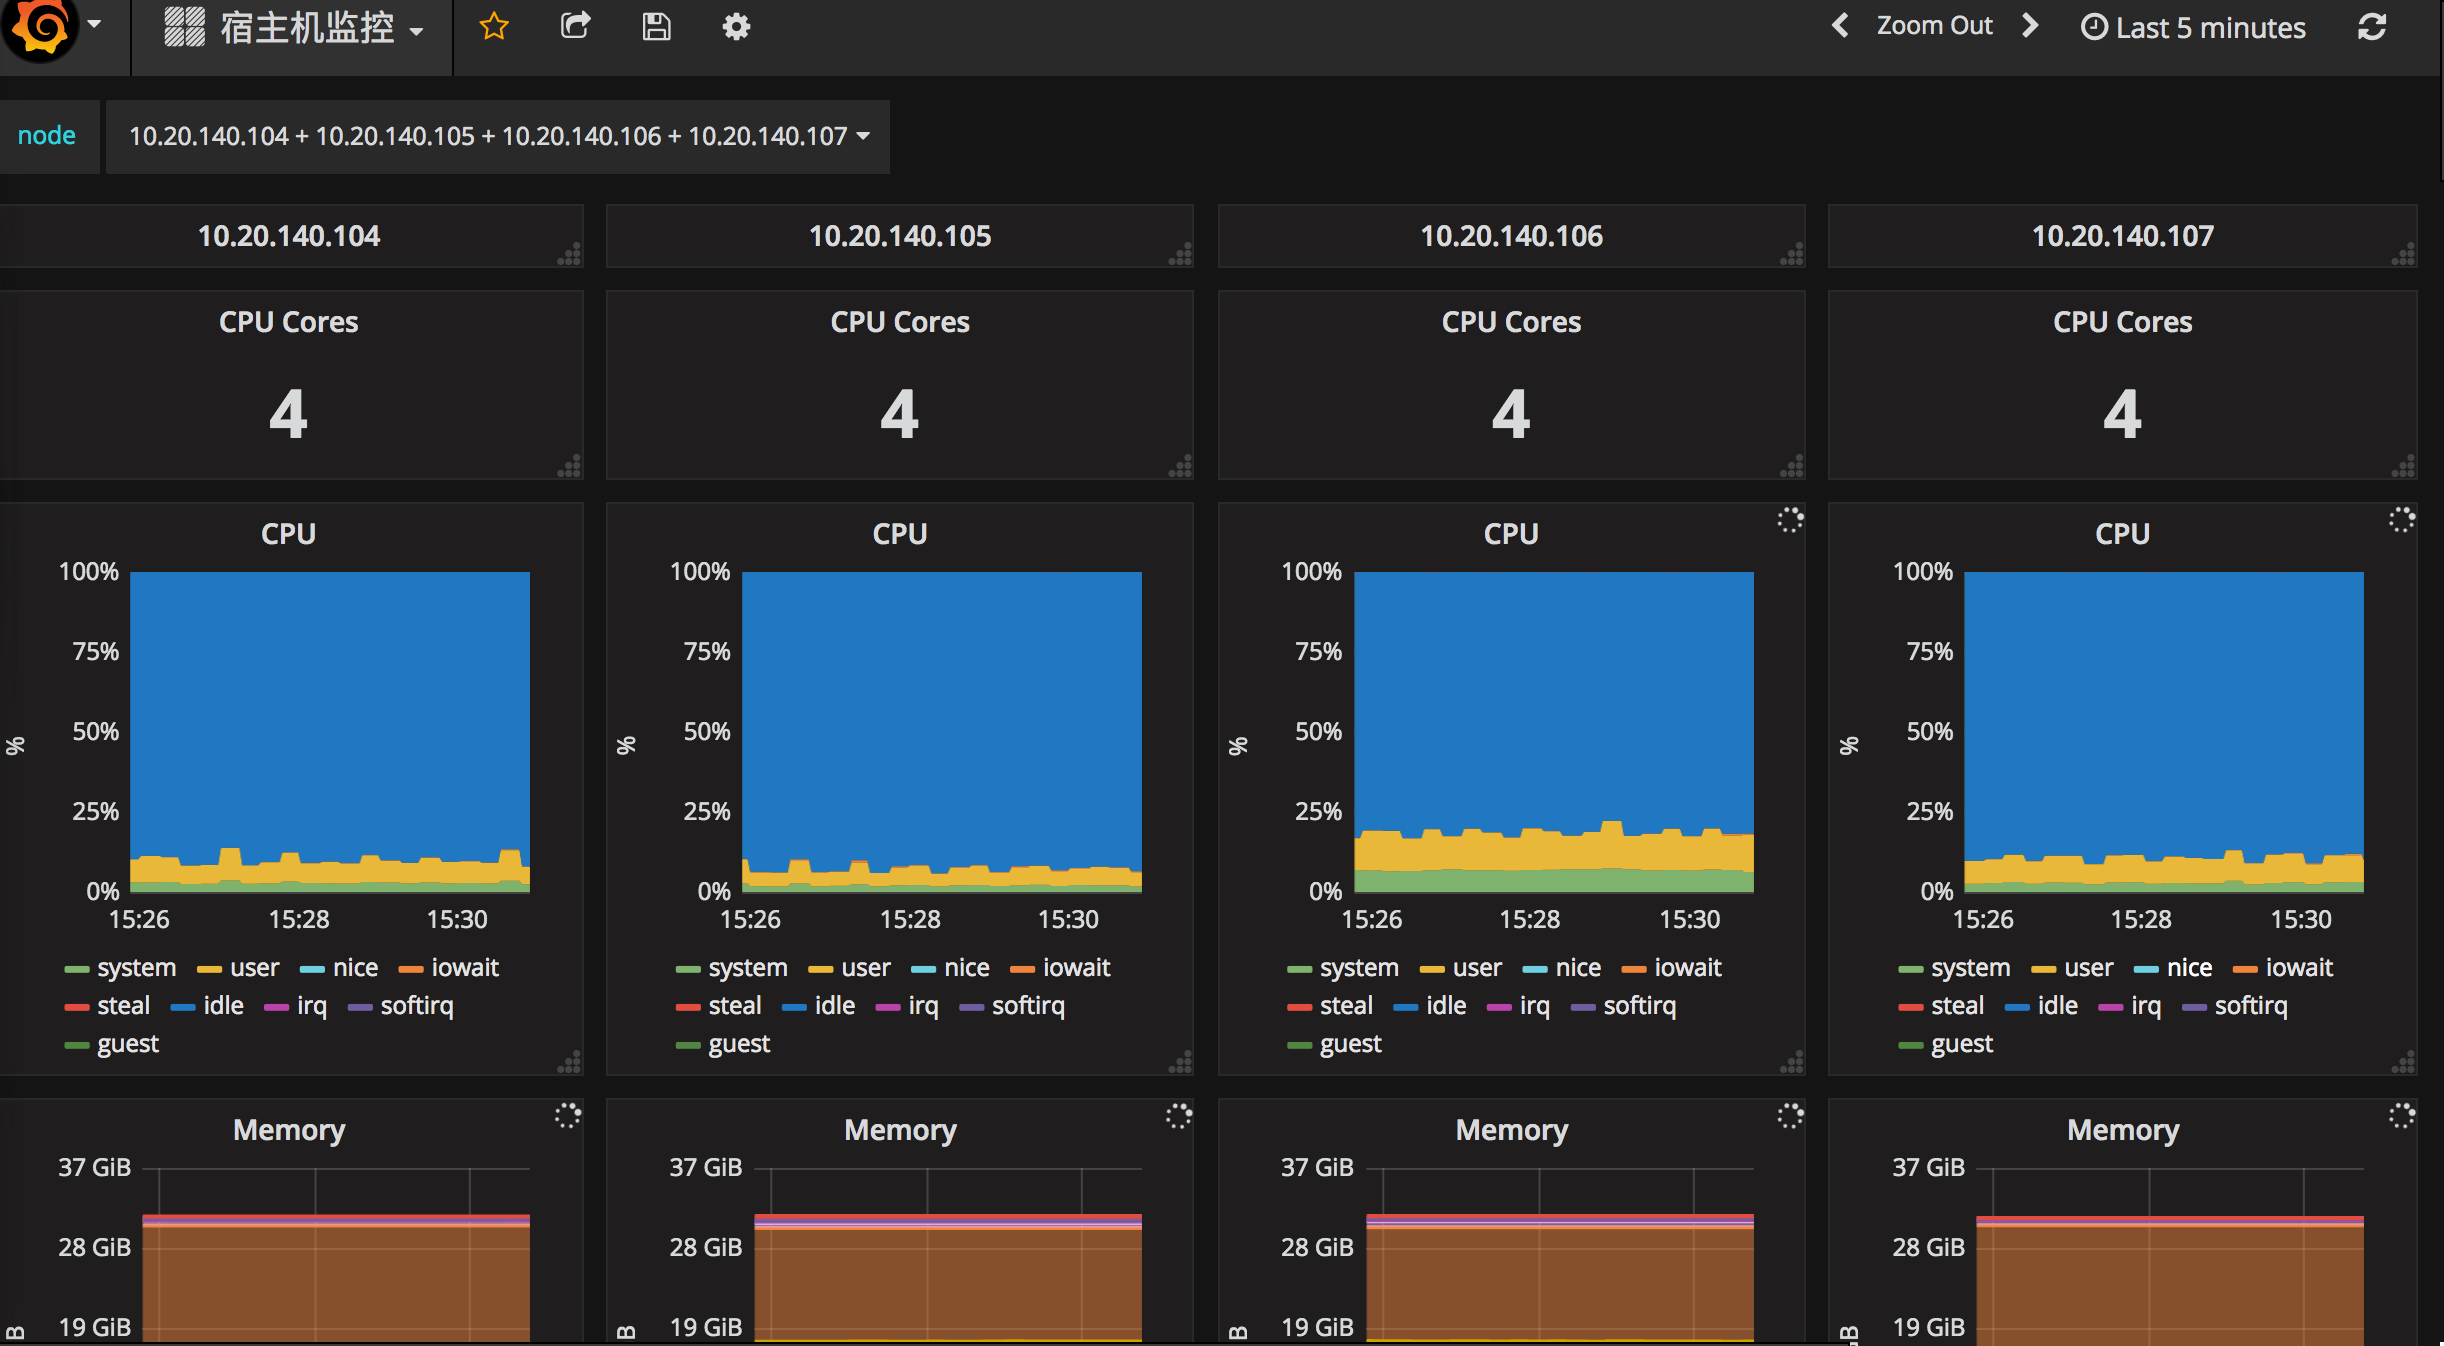
Node-2.json